What Is the Net Promoter Score (NPS)?
The Net Promoter Score (NPS) is a proven metric for measuring customer loyalty and satisfaction. It’s based on a single, powerful question:
“How likely are you to recommend our product or service to a friend or colleague?”
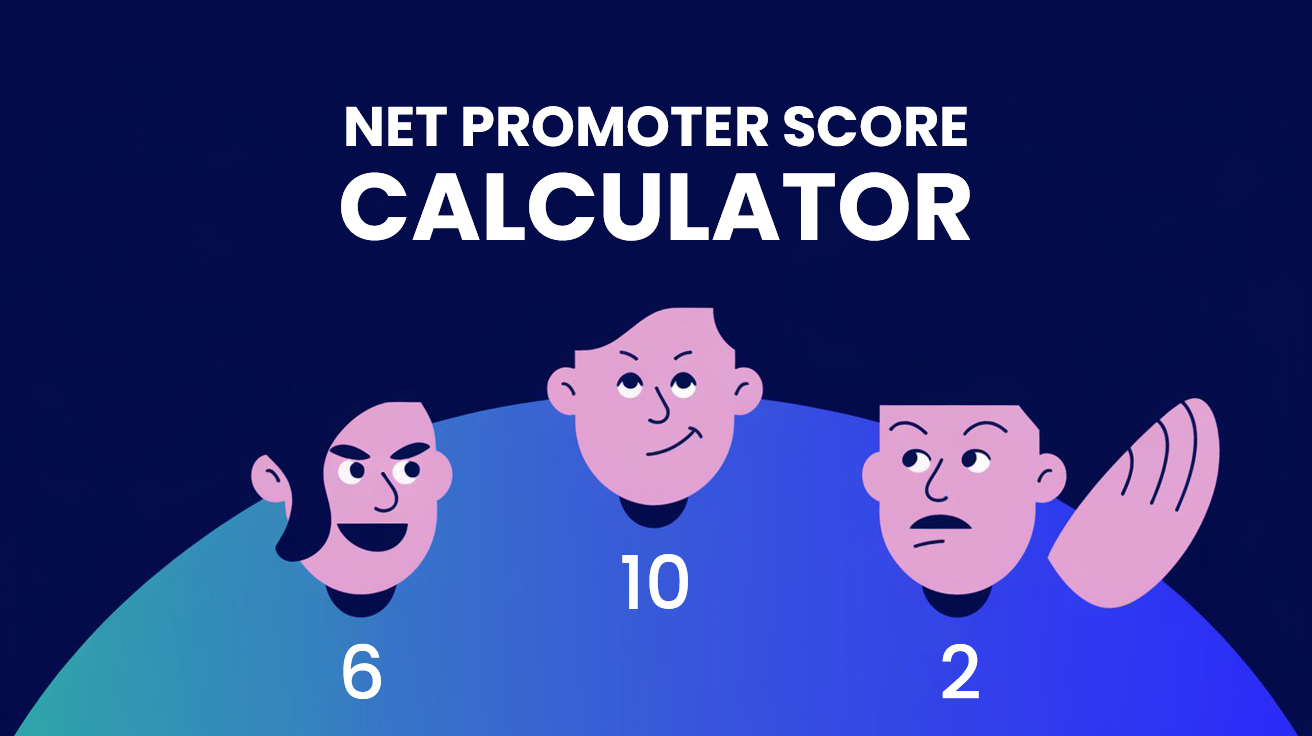
Customers respond on a scale of 0 to 10, which helps companies categorize them into Detractors (0–6), Passives (7–8), or Promoters (9–10). By understanding these categories, businesses can gauge overall sentiment and take targeted steps toward improvement.
Why You Need an NPS Calculator
An NPS calculator does more than just crunch numbers; it provides a real-time snapshot of your customers’ level of loyalty. Here’s why it’s essential:
- Time-Saving: Automates data processing so you can focus on analyzing results.
- Accuracy: Minimizes human error when tallying up responses.
- Scalability: Perfect for businesses handling high survey volumes.
- Actionable Insights: Updates your score as new responses roll in, giving you the latest sentiment data.
Optional Visual Schema:
Include a simple flowchart demonstrating how the calculator processes the number of responses (Detractors, Passives, Promoters) and outputs the final NPS score. This visual will instantly clarify how the tool works.
How to Use an NPS Calculator
- Collect Feedback: Send an NPS survey asking customers to rate their likelihood to recommend your brand on a 0–10 scale.
- Tally Responses: Count how many people gave each rating.
- Enter Values: Go to the calculator at the top of this page and input the tallies into the corresponding fields for scores 0 to 10.
- View Your Score: Instantly see your Net Promoter Score, ranging anywhere from -100 to +100.
The NPS Formula Explained
The Net Promoter Score formula is straightforward:
NPS = (% of Promoters) – (% of Detractors)
- Promoters: Percentage of respondents who chose 9 or 10
- Detractors: Percentage of respondents who chose 0 to 6
- Passives: Percentage of respondents who chose 7 or 8 (they don’t count in the main calculation but are still important to monitor)
Detractors, Passives, and Promoters
When analyzing your NPS survey results, you’ll place respondents into one of three groups:
- Detractors (0–6): Unhappy customers who might spread negative word-of-mouth.
- Passives (7–8): Moderately satisfied customers but not enthusiastic enough to recommend you actively.
- Promoters (9–10): Loyal customers who will champion your brand and drive referrals.
Action Step: Focus on converting Detractors into Passives or Promoters by addressing their concerns. Simultaneously, encourage Promoters to spread the word about your brand.
Interpreting Your NPS Results
- Negative Score (Below 0): You have more Detractors than Promoters—prioritize fixing pressing issues.
- 0 to 30: An okay score, but there’s room for improvement.
- 30 to 50: A good score, indicating solid customer satisfaction.
- 50 to 70: An excellent score—your customers are truly loyal.
- 70 and Above: A world-class score that indicates exceptional loyalty.
When to Use Transactional vs. Relational NPS
Transactional NPS (tNPS)
- Triggered by specific events (e.g., after a customer service interaction or product purchase).
- Offers insights into how customers feel about particular touchpoints in their journey.
Relational NPS (rNPS)
- Sent at regular intervals (e.g., quarterly or annually).
- Aims to gauge the overall relationship customers have with your brand.
Use transactional NPS to pinpoint service gaps after key interactions, and use relational NPS to measure long-term trends in customer loyalty.
NPS Benchmarks: What Is a Good Score?
Benchmarks vary by industry. For example, tech companies often see higher NPS averages than hospitality businesses. As a general rule:
- An NPS above 0 means you have more Promoters than Detractors.
- Scores 30+ are considered good in many industries.
- Scores 50+ indicate excellent loyalty.
- Scores 70+ are truly exceptional.
Research your industry-specific benchmarks to understand how your score compares.
Closing the Loop: Turning Feedback into Action
Measuring your NPS is only the first step. Here’s how to make the most of your results:
- Identify Pain Points: Read through Detractors’ feedback to see what’s causing dissatisfaction.
- Implement Changes: Use these insights to improve products, services, or support.
- Follow Up: Let respondents know you’ve listened to their concerns—this can turn a Detractor into a loyal Promoter.
- Encourage Promotion: Offer a referral program or loyalty discount to Promoters, motivating them to spread the word.
Final Thoughts
Your NPS score is more than just a number; it’s a compass that points you toward customer satisfaction and business growth. By using the free NPS calculator at the top of this page, you’ll gain instant clarity on how your customers feel about your brand.
Don’t stop at just tracking the score. Interpret the feedback and turn insights into strategic actions. Over time, you’ll see customer loyalty rise—and your business success along with it.
FAQs
- How accurate is the NPS calculator at the top of this page?
It’s designed for real-time accuracy. As soon as you input your responses, the calculator processes the numbers and outputs a reliable NPS score. - Can I use this NPS calculator for any industry?
Absolutely! NPS is industry-agnostic. The calculator works the same way whether you’re in tech, healthcare, retail, or B2B services. - How do I improve my NPS quickly?
Focus on your Detractors’ concerns first. Small service improvements and personalized follow-ups often lead to big gains in your score. - What if my NPS score is negative?
A negative score means you have more Detractors than Promoters. Identify core complaints and work to resolve them. Even small changes can have a significant impact on future surveys. - Should I also measure other metrics besides NPS?
Yes. While NPS offers crucial insights into customer loyalty, combining it with additional metrics (like CSAT or CES) can give you a more comprehensive view of the customer experience.
