
Learn to calculate and interpret the margin of error for accurate and reliable survey results. Use our calculator below for quick, easy calculations!
Margin of Error Calculator
Table of Contents
- What Is Margin of Error?
- What Is a Confidence Interval?
- When to Use Margin of Error
- How to Calculate Margin of Error
- How to Interpret Margin of Error
- Factors Influencing Margin of Error
- How to Increase Data Reliability
- Improve Your Margin of Error
- Example Calculation Including Population Size
- Conclusion
What Is Margin of Error?
The margin of error quantifies the level of uncertainty in survey results. It indicates how much the sample results might differ from the true population value due to sampling variability. A smaller margin of error means more confidence in the accuracy of the survey results.
Example:
If a survey reports that 60% of respondents prefer Product A with a margin of error of ±5% at a 95% confidence level, it means you can be 95% confident that between 55% and 65% of the entire population prefers Product A.
What Is a Confidence Interval?
A confidence interval is a range of values that is likely to contain the true population parameter. It combines the sample estimate and the margin of error to provide an interval within which the true value lies, given a certain level of confidence.
Relation to Margin of Error:
- The confidence interval is calculated as:

- The confidence level (e.g., 90%, 95%, 99%) represents the probability that the confidence interval contains the true population parameter.
When to Use Margin of Error
Use the margin of error in:
- Survey Planning: To determine the required sample size for desired accuracy.
- Interpreting Results: To understand the reliability and precision of survey findings.
- Decision Making: To assess the risk associated with business or policy decisions based on survey data.
Example:
A political campaign wants to know the percentage of voters who support their candidate. Knowing the margin of error helps them understand how precise their poll results are and how much confidence they can place in the findings.

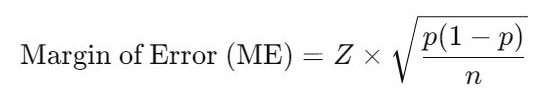
How to Calculate Margin of Error
Margin of Error Formula
For proportions (percentages):
For means (averages):
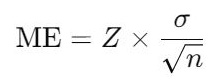
Where:
- Z = Z-score corresponding to the desired confidence level.
- p = Sample proportion (expressed as a decimal).
- n = Sample size.
- σ = Population standard deviation (use sample standard deviation s if σ is unknown).
Z-Scores for Common Confidence Levels
| Confidence Level | Z-Score |
|---|---|
| 80% | 1.28 |
| 90% | 1.645 |
| 95% | 1.96 |
| 99% | 2.576 |
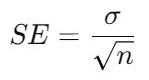
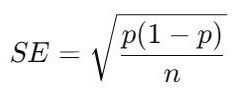
Steps to Calculate Margin of Error
- Determine Your Confidence Level and find the corresponding Z-score.
- Collect Your Data: Obtain your sample size (n) and sample proportion (p) or standard deviation (σ).
- Calculate the Standard Error (SE):
- For proportions:
- For means:
- Compute the Margin of Error:

Practical Example
Scenario:
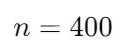
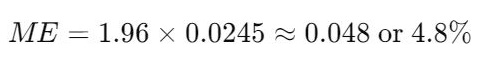
You survey 400 customers to find out if they like a new product. Out of 400, 240 say they like it.
Calculation:
- Sample Proportion (p):
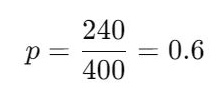
- Sample Size (n):
- Choose Confidence Level: 95% (Z-score = 1.96).
- Calculate Standard Error (SE):
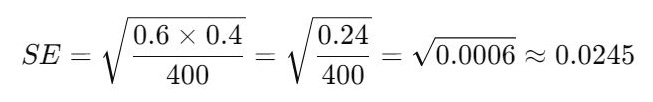
- Calculate Margin of Error (ME):
- Confidence Interval:

Interpretation:
With 95% confidence, between 55.2% and 64.8% of all customers like the new product.
How to Interpret Margin of Error
The margin of error indicates the range within which the true population parameter is expected to fall.
- Smaller Margin of Error: Greater confidence in the precision of your results.
- Larger Margin of Error: Less certainty about how well your sample represents the population.
Points to Consider:
- Always report the margin of error along with survey results.
- Use it to compare different surveys or studies.
- Be cautious when the margin of error is large relative to the estimate.
Factors Influencing Margin of Error
1. Sample Size (n)
- Effect: Increasing sample size decreases the margin of error.
- Reason: Larger samples provide more information, reducing uncertainty.
- Example: Suppose you’re conducting a survey to estimate the average height of adults in a city. If your sample size is 100 people, the margin of error might be 5 cm. By increasing the sample size to 1,000 people, the margin of error could shrink to 1.5 cm, reflecting more confidence in the estimate.
2. Confidence Level (Z-score)
- Effect: Higher confidence levels increase the margin of error.
- Reason: Greater confidence requires a wider interval to ensure the true value is captured.
- Example: If you’re 90% confident that the average income in a town is between $40,000 and $50,000, your margin of error might be $5,000. However, increasing the confidence level to 99% might expand the interval to $38,000 to $52,000, increasing the margin of error to $7,000.
3. Variability in Data (Standard Deviation σ or Proportion p)
- Effect: More variability leads to a larger margin of error.
- Reason: High variability means the data points are more spread out, increasing uncertainty.
- Example: If you’re estimating the percentage of voters supporting a candidate, and the population is fairly uniform (low variability), your margin of error might be small, such as ±3%. But in a population with diverse opinions (high variability), the margin of error might rise to ±8%, reflecting more uncertainty in the estimate.
How to Increase Data Reliability
1. Define Your Population Clearly
- Ensure your sample accurately represents the group you’re studying.
2. Increase Sample Size
- Larger samples reduce sampling error and narrow the margin of error.
3. Use Random Sampling
- Randomly select participants to minimize selection bias.
4. Improve Survey Design
- Use clear, unbiased questions to get accurate responses.
5. Pilot Testing
- Test your survey on a small group to identify and fix issues before full deployment.
Improve Your Margin of Error
To achieve a better (smaller) margin of error:
- Increase Your Sample Size: This is the most direct way to reduce the margin of error.
- Adjust Your Confidence Level: Accepting a lower confidence level can decrease the margin of error (use cautiously).
- Reduce Variability: Use more precise measurement tools or methods.
Example:
If your current margin of error is ±5% with a sample size of 400, increasing your sample size to 1,000 can reduce your margin of error to approximately ±3%.
Example Calculation Including Population Size
Scenario:
Suppose you have:
- Population Size (N): 5,000
- Sample Size (n): 600
- Sample Proportion (p): 0.75
- Confidence Level: 90% (Z-score = 1.645)
Calculation Steps:
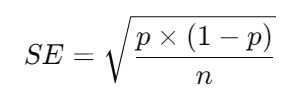
1. Calculate the Standard Error (SE):
The standard error measures the variability of the sample proportion.
Plug in the values:
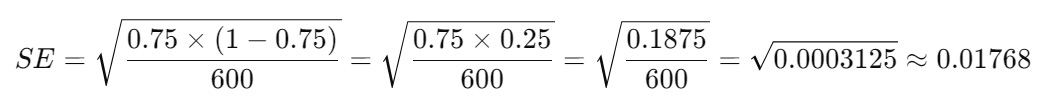
2. Apply the Finite Population Correction (FPC):
Since the sample size is a significant fraction of the population (more than 5%), we need to adjust the standard error using the Finite Population Correction to account for the reduced variability.
The FPC factor is calculated as:
Plug in the values:
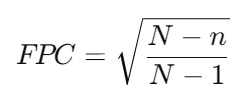
3. Adjust the Standard Error using FPC:
Multiply the standard error by the FPC to get the adjusted standard error.
![]()
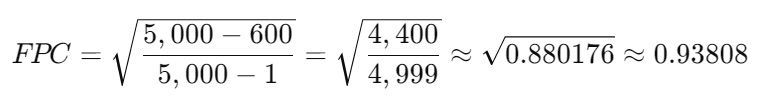
4. Calculate the Margin of Error (ME):
Plug in the values:
![]()
5. Determine the Confidence Interval:
![]()
Calculate the lower and upper bounds:
- Lower Limit:
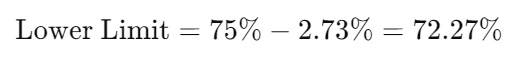
- Upper Limit:
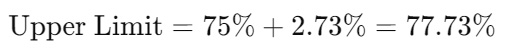
Interpretation:
With a 90% confidence level, you can be confident that between 72.27% and 77.73% of the total population of 5,000 have the characteristic being measured (e.g., preference for a product).
Including the Population Size (N) reduces the margin of error because sampling a large portion of the population increases the precision of your estimate.
Note: The Finite Population Correction (FPC) is important when your sample size is more than 5% of the total population. In this example, the sample size of 600 is 12% of the population size of 5,000, so applying the FPC is appropriate.
Conclusion
Understanding the margin of error is essential for interpreting survey results accurately. By calculating and considering the margin of error, you can:
- Assess the reliability of your survey data.
- Make informed decisions based on statistical evidence.
- Communicate findings with an appropriate level of confidence.
Remember, the margin of error is influenced by sample size, confidence level, and data variability. Adjusting these factors can help you achieve the desired precision in your research.
FAQ
1. What is the margin of error in a survey?
The margin of error quantifies the uncertainty in survey results, indicating how much the sample results might differ from the true population value due to sampling variability.
2. How do you calculate the margin of error?
For proportions: Margin of Error = Z * sqrt[ p * (1 – p) / n ]
Where Z is the Z-score for your confidence level, p is the sample proportion, and n is the sample size.
3. What is a confidence interval and how is it related to the margin of error?
A confidence interval is a range that likely contains the true population parameter. It’s calculated as the sample estimate plus or minus the margin of error.
4. Why is the margin of error important?
It helps assess the reliability and precision of survey findings, guiding decision-making based on statistical evidence.
5. How can I reduce the margin of error in my survey?
You can reduce the margin of error by increasing your sample size, lowering the confidence level, or decreasing variability in your data.
6. What factors influence the margin of error?
The main factors are sample size, confidence level, and variability in the data.
7. When should I use the finite population correction (FPC)?
Apply the FPC when your sample size is more than 5% of the total population to adjust the margin of error for reduced variability.
8. What does a margin of error of ±5% mean?
It means the true population parameter is expected to fall within 5 percentage points above or below your sample estimate, given your confidence level.
9. How does sample size affect the margin of error?
Increasing the sample size decreases the margin of error, enhancing the precision of your survey results.
10. What is a Z-score in the context of margin of error?
A Z-score corresponds to the desired confidence level and is used in calculating the margin of error. Common Z-scores are 1.96 for 95% confidence and 1.645 for 90% confidence.